
607 MB or 1,450 MB: what LiteRT-LM's memory number measures
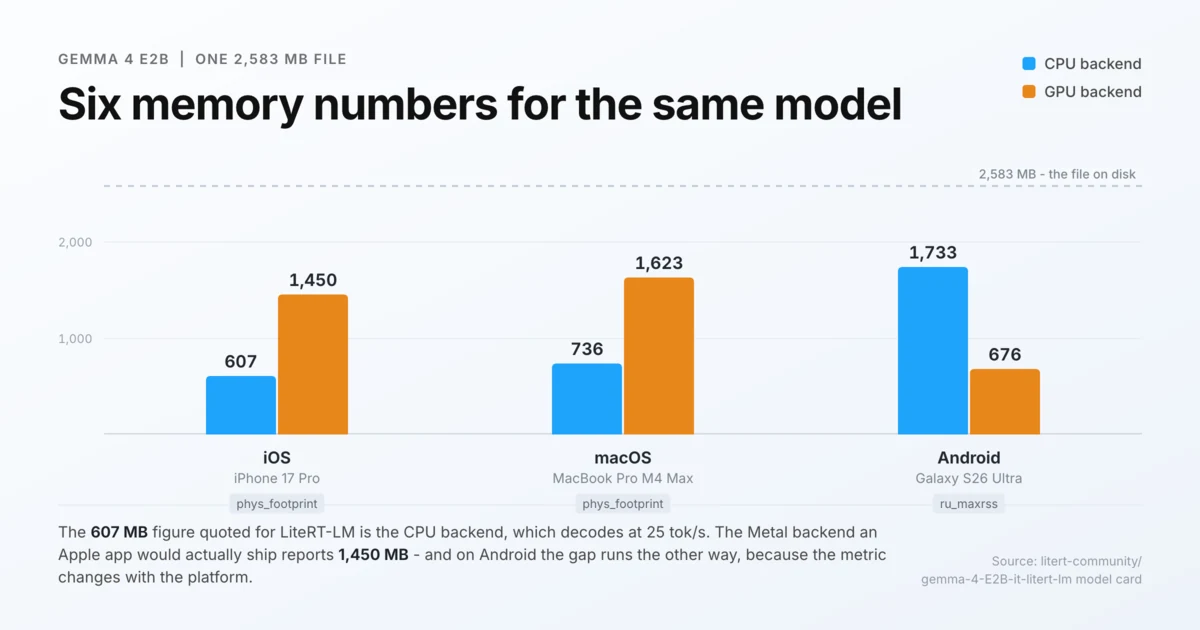
The most quoted number about Google's LiteRT-LM is a memory figure: a 2.58 GB Gemma 4 E2B model running in 607 MB. Against the 2,900 MB an MLX build of the same model occupies on the same phone, that is a 4.5x difference, and it is the number that makes LiteRT-LM look like a step change rather than an increment.
It is also the number that falls apart first. Google's own model card reports a different memory figure for every platform-and-backend row - 607 MB and 1,450 MB on the same iPhone - and a footnote on the card says Apple platforms were measured with one operating-system metric and Android with another. The two metrics do not count the same bytes, and neither counts what a phone actually has to hold in RAM.
Enigmus runs its inference on mlx-swift-lm, and LiteRT-LM was evaluated as a possible replacement, so the figure mattered enough to take apart. This post is about what the memory number in an on-device LLM benchmark measures, using that evaluation as the worked example, and about what the rest of the LiteRT-LM stack looks like from a Swift project today.
One architectural fact frames it. Gemma 4's E-series uses per-layer embeddings: per the Gemma 4 technical report, E2B has 2.3B effective parameters out of 5.1B in total, and the 2.8B gap is lookup tables that never enter the matrix multiplies. LiteRT-LM's model card states that "the runtime uses memory mapping to support the 1.12GB of embedding parameters", so roughly 1.12 GB of the file is paged in from disk on demand rather than loaded. Everything below follows from how that shows up when the process is measured.
Google's own table, read properly
The model card publishes per-platform benchmarks. Collected into one place, with the decode speed each memory figure was measured alongside:
| Platform | Device | Backend | Decode | Memory | Metric used |
|---|---|---|---|---|---|
| iOS | iPhone 17 Pro | CPU | 25.0 tok/s | 607 MB | phys_footprint |
| iOS | iPhone 17 Pro | GPU | 56.5 tok/s | 1,450 MB | phys_footprint |
| macOS | MacBook Pro M4 Max | CPU | 41.6 tok/s | 736 MB | phys_footprint |
| macOS | MacBook Pro M4 Max | GPU | 160.2 tok/s | 1,623 MB | phys_footprint |
| Android | Galaxy S26 Ultra | CPU | 46.9 tok/s | 1,733 MB | ru_maxrss |
| Android | Galaxy S26 Ultra | GPU | 52.1 tok/s | 676 MB | ru_maxrss |
| Linux | Arm 2.3/2.8 GHz | CPU | 35.0 tok/s | 1,628 MB | ru_maxrss |
| Linux | RTX 4090 | GPU | 143.4 tok/s | 913 MB | ru_maxrss |
| Windows | Intel Lunar Lake | CPU | 29.8 tok/s | 3,505 MB | PrivateUsage |
| Windows | Intel Lunar Lake | GPU | 48.4 tok/s | 3,540 MB | PrivateUsage |
The model file is 2,583 MB in every row. Three things fall out.
The famous memory number and the famous speed number are different rows. 607 MB is the CPU backend, decoding at 25.0 tok/s. Google's announcement post attributes the 607 MB figure to "Apple mobile CPUs utilizing XNNPACK's weight caching mechanism", XNNPACK being a CPU inference library. The same post's headline speed claim, 56 tok/s on iOS, is the Metal backend, and on that backend the card reports 1,450 MB. An Apple app shipping LiteRT-LM would use Metal, so the operative iPhone figure is 1,450 MB: 2.4x the quoted number, for the same file on the same phone.
The direction of the CPU-to-GPU difference reverses between Apple and Android. On iOS, moving to the GPU raises reported memory (607 -> 1,450). On Android it lowers it by a similar factor (1,733 -> 676). A property of a runtime does not invert with the operating system. A property of a measurement does.
Every figure outside Windows is below the 2,583 MB file, and both Windows figures are above it. The same file, mapped the same way, is reported anywhere from a quarter of its size to well over it depending on which counter is read.
The footnote that explains it
The model card documents its own methodology, and this sentence resolves the table:
CPU memory was measured using
rusage::ru_maxrsson Android/Linux/Raspberry Pi,task_vm_info::phys_footprinton iOS/macOS, andprocess_memory_counters::PrivateUsageon Windows.
ru_maxrss is peak resident set size: physical pages the process has resident, including clean file-backed pages from a mapping. Map a gigabyte of embeddings and touch it, and ru_maxrss shows it.
phys_footprint is Apple's footprint metric, and it deliberately excludes those pages. Apple's definition, from WWDC22 session 10106:
For clean memory pages, they include read-only files mapped from disk, such as texture or audio assets, and frameworks loaded into the process. The system can empty or reload them from disk at any time, so they don't count towards your game's memory footprint.
So on Apple platforms the 1.12 GB of mapped embeddings is definitionally invisible to the number being reported, and on Android the equivalent pages are counted. 607 MB on iOS against 1,628-1,733 MB on Linux and Android are not measurements of different efficiency. They are measurements of different quantities.
The same session explains the reversal. Describing dirty memory, which does count:
On devices with Apple silicon, accessed Metal resources also fall into this category - this is because CPU and GPU share the same pool of fast unified memory.
On Apple silicon the GPU path moves weights out of exempt clean mappings into fully charged Metal buffers, and the footprint goes up. On Android the GPU path moves them into OpenCL allocations outside the process's resident set, and the RSS goes down. Same underlying change, opposite accounting.
Apple attaches the necessary caveat to its own exemption in the same session: clean pages "may be resident on memory, and excessive use will slow down the system". Uncharged is not free. The pages are in RAM, competing for it.
What is actually real
Netting the artifact out does not leave nothing.
Mixed-bit quantization is real. The E2B .litertlm is 2.6 GB at a mixture of 2-, 4- and 8-bit weights, against 4.0 GB for the uniform 4-bit MLX build in the Enigmus catalog. A smaller file is a smaller resident core on any metric. It is also a different quality point, so output is not directly comparable in either direction.
Demand-paging a cold 1.12 GB tail is real, not as a reduction in bytes needed but as a change in what kind of bytes they are. Clean file-backed pages can be evicted under pressure and re-faulted from SSD. Dirty Metal buffers cannot. On iOS they can only be compressed or swapped, or the process gets killed.
That second point cuts in LiteRT-LM's favour on iOS, because jetsam terminates apps on phys_footprint - the same metric that exempts clean mapped pages. What looks like a measurement trick in a benchmark table is a survival advantage in the field: under memory pressure a mapped-weights runtime gets slower, and a Metal-buffer runtime gets killed. Apple publishes no per-device limits, but a developer report on Apple's forums puts os_proc_available_memory on a 4 GB iPhone 13 at about 2.2 GB. Against that ceiling a 2,900 MB MLX build does not fit and 1,450 MB does.
On the backend an Apple app would actually ship, then, the memory gain is closer to 2x than 4.5x, and the remaining advantage is as much about survivability as about size. None of this generalizes beyond the model family: the artifact is large here because the E-series puts an unusual share of its parameters into cold lookup tables. A conventional dense model has no large mmap-able tail to hide.
Two more measurements, neither reconcilable
The most cited third-party comparison is john-rocky's iPhone 17 Pro runtime benchmark: Gemma 4 E2B, 128-token chat, median of three cold runs.
| Runtime | Decode | Peak RAM |
|---|---|---|
| LiteRT-LM | 55.4 tok/s | 641 MB |
| MLX-Swift | 47.5 tok/s | 2,900 MB |
| llama.cpp | 37.8 tok/s | 3,156 MB |
| Core ML / ANE | 33.4 tok/s | 1,187 MB |
Its two LiteRT-LM columns come from different rows of Google's table: 55.4 tok/s matches the card's GPU figure of 56.5, but 641 MB sits next to the card's CPU figure of 607 MB, while the card's GPU figure for the same phone is 1,450 MB. The benchmark does not state which memory API it used, so the 2.3x gap cannot be resolved from the published material.
The in-house comparison was run on one 24 GB Apple-silicon Mac with the same prompt: MLX on the 4.0 GB uniform 4-bit build, LiteRT-LM v0.13.1 on Metal with the 2.59 GB mixed-bit .litertlm.
| Metric | MLX 4-bit | LiteRT-LM E2B | Note |
|---|---|---|---|
| Load time | 4.54 s | 1.35 s warm | full read into Metal buffers vs mmap |
| Reported memory | 4,077 MB (GPU.activeMemory) | +479 MB peak (phys_footprint) | different metrics - not a ratio |
| Tokens/sec, wall | 33.30 | 33.9 | parity |
| Tokens/sec, generation only | 33.79 | 39.3 (53.6 sustained) | +16% |
The memory row shows the only figures each runtime exposes. They are not the same quantity, and the LiteRT-LM figure does not reconcile with Google's 1,623 MB for macOS GPU either: a delta from process baseline on a different machine, with a backend that logs itself as WebGPU over Metal, against an absolute figure from an undocumented setup.
The speed row is trustworthy: +16% on generation-only decode, consistent with the +17% in the iPhone benchmark. Two agreeing measurements on different hardware put the Gemma decode advantage in the mid-teens percent before multi-token prediction, well short of the "1.8x to 3.7x faster prefill and decode than llama.cpp, MLX, Cactus, ONNX" reported from Google's launch material. Prefill is where LiteRT-LM's margins are large, and that figure reads as prefill-weighted.
The load-time difference relocates cost rather than removing it. MLX pays the whole cold cost in the load bar. LiteRT-LM maps the file, so after a sudo purge initialization does not change (1.32 s cold against 1.35 s warm) and the cost reappears in the first generation as pages fault in from SSD: time-to-first-chunk of 1,145 ms against 703 ms, first-generation decode of 31.8 against 39.3 tok/s.
No comparison here holds KV-cache size constant, and it is a first-order term in footprint. The LiteRT-LM runs used maxNumTokens: 512, the MLX side runs uncapped with 4-bit KV on iOS, and the iPhone benchmark states no context length.
The rest of the stack
Three practical findings matter more to adoptability than the measurement question does.
The Swift package cannot be installed the way Google documents it. The Swift guide says to add the repository URL in Xcode. That fails for three independent reasons. The manifest compiles the wrapper with linkerSettings: [.unsafeFlags(["-Xlinker", "-all_load"])], and SwiftPM refuses products with unsafe flags as remote dependencies; only local path references are exempt. The repository LFS-tracks around 44 prebuilt binaries, and SwiftPM checks out from a local bare mirror that never fetches LFS objects, so on any machine with git-lfs installed the checkout dies with a misleading remote missing object error. And v0.14.0's Swift sources call C symbols that do not exist in the v0.13.1 binaries its own manifest pins, because no v0.14.0 XCFramework was released. The newest self-consistent tag is v0.13.1, and any integration needs a committed local copy: submodule, vendored sources, or a bootstrap clone.
The models are license-gated, and their hashes are masked. litert-community Gemma repositories return 401 on resolve/ downloads anonymously, unlike the un-gated mlx-community mirrors. Hugging Face also masks LFS sha256 object IDs on gated repositories, so a download cannot be pinned to a hash without a token. Shipping would mean self-hosting the files under the Gemma license's redistribution terms, at about 2.6 GB per install, or a bring-your-own-token flow.
GPU capability is a per-conversion property, and the runtime does not check it. gemma-3-270m-it at q8 is not GPU-capable; its card says GPU support is still in progress. Requested with backend: .gpu it initializes without complaint, streams at 110 tok/s, and emits pure special-token soup - <pad><unused16>... - with no error and no warning. An integration has to gate model-by-backend compatibility itself, and its tests need a coherence check rather than a non-empty check.
Two further gaps decide the question. mlx-community holds thousands of checkpoints loadable as plain safetensors; the .litertlm catalog is a short list with no Qwen3 30B or 80B MoE equivalent and no supported conversion path, so an entire product line does not run on it. And LiteRT-LM documents no equivalent of GPU.activeMemory: the runtime whose headline advantage is memory cannot report its own memory use to the application.
Where Enigmus lands
LiteRT-LM is not a replacement for the MLX pipeline today. The runtime itself is good: 16-17% faster Gemma decode, faster loads, large prefill margins, and a survivability advantage on memory-constrained iPhones that outlives the deflated headline figure. What blocks it is everything around the runtime: a package that cannot be added as documented, a broken newest tag, gated models with masked hashes, a closed-source prebuilt core, a catalog that omits the models most used, and no memory introspection.
The re-check conditions are concrete, and all four are Google's to fix: a manifest without unsafe build flags or an official binary-only package; a repository without LFS-tracked build inputs; tags whose Swift sources and shipped binaries agree; and a model channel that is un-gated or authenticable from inside an app. When those land, the evaluation is worth running again - on one machine, with one metric, named.
Related posts
Core AI: a first look at Apple's new on-device model runtime
At WWDC 2026 Apple introduced Core AI, a new framework for running machine-learning models on …
Enigmus 1.2: Qwen 3.5 and 3.6, and memory handling improvements
Enigmus runs open-weight language models entirely on device, on iPhone, iPad and Mac, with …